This is What I Want (What I Really Really Want):
Zeroes to Rank Poorly. Divide by Zero Errors to Display “N/A.” And “N/A” to NOT participate in my ranking.
RANKX: the Mother of Many Blog Posts
Ya know, we could probably write articles about RANKX for an entire year. There are just SO many subtleties to it, and SO many different ways you might want to rank things. Endless source of blog fodder.
For example, let me share a hiccup I had to fix recently for our No Checkdowns site.
DIVIDE()’s Awesome Third Argument
You probably are already aware, but just in case, Part ONE: you don’t need to do IFERROR() to protect yourself against division by zero in DAX. Just use the DIVIDE function, and you’ll get blank cells instead of errors whenever you have a division by zero.
You probably are already aware, but just in case, Part TWO: DIVIDE offers an optional third argument which allows you to return a result other than BLANK() in case of div by zero. Usually I leave it empty and just roll with the blank result. But sometimes, I’ve used 1 or 0 as the optional third argument – because in some fairly rare circumstances, you want to treat a div by zero as 0% or 100%.
You probably are already aware, but just in case, Part THREE: that third argument can also take a TEXT value! So, instead of returning an error, or a blank, or a 1/0… you can return something like “N/A.”
Consumers Love Them Some “N/A”
A blank cell in a report is sometimes a source of confusion for those human beings consuming our work. “What does a blank cell mean,” they ask. “It’s a division by zero,” we reply. “Wut,” they then ask. “Trust me,” we say, “you don’t want to see the alternative.” “But I don’t trust you, and now I don’t trust this whole report,” is what they sometimes say next – whether under their breath or out loud.
But “N/A” is a lovely value to display. It raises far fewer eyebrows. “Oh, it says our Profit Margin % for electric blankets sold in Cancun is “N/A” – I get it, we’ve never sold that product there.” No convo required.
So Let’s Use It!
It doesn’t get any more “consumerish” than a report displaying sports data, so I’ve chosen to use “N/A” as the third argument to a lot of my DIVIDE() measures.
For example:
Pass Accuracy % = DIVIDE([Accurate Passes],[Pass Att Qualified],”N/A”)
and then, from that, I derive another measure…
Accuracy % Left Seam = CALCULATE([Pass Accuracy %],DimZone[Seam]=”Left Seam”)
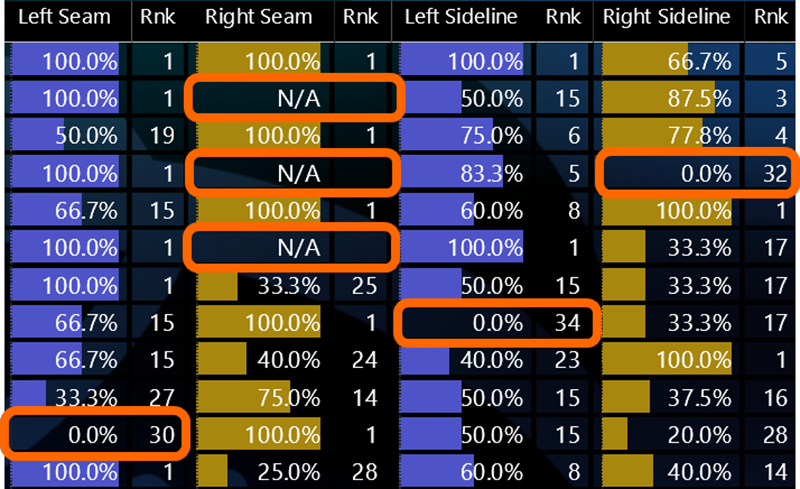
And it looks great:

“N/A” Looks Great – But the fact that it sorts to the top hints at future troubles.
(In this case, N/A “means” that this player has not even attempted
such a pass, so there can be no accuracy number)
Now, Release the RANKX!
Let’s write the most straighforward version…
Bad Rank v1 = RANKX(ALL(DimQB),[Accuracy % Left Seam],,,Skip)
…and compare it side-by-side with what I WANT to see…
")
I don’t want N/A’s to rank first. AND I don’t want them “demoting” my TRUE Top-Ranked Items to 4.
First: Let’s Stop Ranking the N/A’s
OK, no problem! Let me just wrap that RANKX in an IF(ISNUMBER()) test…
Bad Rank v2 = IF(ISNUMBER([Accuracy % Left Seam]),
RANKX(ALL(DimQB),[Accuracy % Left Seam],,,Skip)
,BLANK())
Now, we could have returned something other than BLANK() for the else of the IF. Maybe… COUNTROWS(DimQB) so that they always rank last? But in this case I just don’t even want them to get a rank, and a blank cell WILL be understood by the consumer if it’s sitting next to an “N/A.”
So anyway, let’s see what that IF-ISNUMBER-BLANK approach gives us…

Fixed the First Problem, But… Still Need to Fix the “Demotion” Problem
Fixing the Demotion Problem
This is trickier, since our IF test does NOT get triggered on the “Brissett, J” row, for example, and that IS a row where we need to return a different result (1, rather than 4).
In order to do this, we need to take the N/A’s out of the population that RANKX looks at. Which happens in that first argument, where we’re currently passing ALL(DimQB).
Time for our good friend, FILTER()…
Bad Rank v3 = IF(ISNUMBER([Accuracy % Left Seam]),RANKX(FILTER(ALL(DimQB),ISNUMBER([Accuracy % Left Seam])),[Accuracy % Left Seam],,,Skip),BLANK())
Bad Rank v3 = IF(ISNUMBER([Accuracy % Left Seam]),
RANKX(FILTER(ALL(DimQB),ISNUMBER([Accuracy % Left Seam])),
[Accuracy % Left Seam],,,Skip
)
,BLANK())
The highlighted portion basically says “yeah, START OUT with every row of DimQB, but then remove rows with a non-numerical value for [Accuracy % Left Seam] before you start your ranking work.”
What does this yield?

It Matches My “Rank That Works” Column Perfectly – so Why Am I Still Calling It “Bad Rank v3?”
Sneaky Remaining Problem: Try Filtering the Visual a Bit
Let’s say I want to just see the QB’s who went pro within the past five years, so I slap a filter on the table visual…

OK… NOW my “Bad Rank v3” is Returning Different Results than “What I Want.”
(Of course… sometimes this IS what I would want. But not in this case.)
Look at Marcus Mariota. Bad Rank v3 says he’s 6th-best. But there are only two QB’s ranked above him in this report! Shouldn’t he be third-ranked?
Yeah, trouble is… Bad Rank v3 is still looking at ALL of the rows of the DimQB table behind the scenes! Including “Brissett, J.” who went pro MORE than five years ago, and is not showing up in our table anymore (thanks to the filter).
OK, easy fix… replace ALL with ALLSELECTED.
Ranks that Works = IF(ISNUMBER([Accuracy % Left Seam]),
RANKX(FILTER(ALLSELECTED(DimQB),ISNUMBER([Accuracy % Left Seam])),
[Accuracy % Left Seam],,,Skip
)
,BLANK())
Remove the “bad” measures, replicate this pattern a few times, format it extensively… and… Voila!

A Beautiful Ranking Exercise If I’ve Ever Seen One
(Click Image to Visit an Interactive Version of the Report on NoCheckdowns.com)
