
Navigating the sea of data
One of the many things which amazes me about Power Pivot time after time is its ability to effortlessly convert raw data into crucial information as soon as it happens. For example, receivables not being paid on time, and payment terms extended for a particular transaction by a salesperson are crucial information that would otherwise be buried in a sea of data.
Although standard ERP systems have all the data for accounts receivable by customers, checking customer AR balances through ERP involves a snail-like process. Typically this entails keying in the customer code into a field box and checking the balance and aging for the outstanding amounts one by one. Even though the data is all there in the system, for a company with more than several thousand customers, identifying and properly acting upon overdue accounts receivable on a timely basis tends not to be such a quick exercise when using ERP alone.
Against this backdrop, over the past several years, Power Pivot and Power Query have empowered accountants to do their job better and faster. The real-time identification of issues concerning the company’s accounts receivable collections is one such example.
Credit control with Power Pivot
While details of credit control policy vary from company to company, its primary objective of reducing the risk of AR non-collection is a common feature across many companies in different industries. Given that it is such a crucial area in the remit of accounting departments, I am sure that other tech-savvy accountants (the kind of high-tech bean counters who read P3 Adaptive blog posts), must also have implemented similar Power Pivot AR monitoring applications in their organizations. For another P3 Adaptive blog post on this topic, please refer to an earlier post by David Churchward.
Business need for real-time information
If we want to improve the collection from customers, preparing or extracting a customer’s aging report once a month in the traditional way is not good enough. By the time the report reaches its consumers, both the balance and situation will most likely have changed, and because of this, it is often obsolete. As more and more transactions get recorded during business time, and some receivables get cleared as customers pay, balances always change with the passage of time. Businesses need real-time information and not stale information relating to the previous week or even yesterday, to take an appropriate course of action.
A prior way of sharing real-time information
In my particular environment, previously these pieces of real-time information were shared with internal customers (i.e., individual sales reps) over the phone as and when required. This may sound like an episode from the stone age for some high-tech folks. But before the implementation of the Power Pivot AR monitoring system, I used to get asked frequent questions over the phone from sales people such as:
- “What is the current AR balance in SAP and how much is the remaining credit limit for customer X?”
- “Has the customer paid today to avoid reaching the approaching credit limit?”
- “When will the customer pay next and how much will they pay?”
- “How much insurance coverage does the customer have?”
- “Will the current credit limit level last until the next collection due date or do they (the salesperson) need to apply for an additional credit limit to make more sales to the same customer?”
Many of these questions required an accountant to share real-time information with individual sales reps by checking the current ERP information and insurance database with the insurer and in cases where the collections were not yet recorded in ERP, by checking the online banking system. However, as you can imagine, answering numerous questions from sales reps is an inefficient way of sharing information especially when there are often several dozen salespeople for each accountant in a firm.
![]() From the Stone Age to the Smart Age: The Data Revolution
From the Stone Age to the Smart Age: The Data Revolution ![]()
Being an automation aficionado, revamping the antiquated telephone AR information service soon became my top priority. Specifically, to reduce the number of phone calls requiring the provision of real-time information, I incorporated all the information which could be requested from the ERP accounting module on AR (and more from other data sources) in a daily report. This included information such as the current AR amount, credit limits, remaining credit limits, the credit limit usage percentage, customer payment terms, the weighted average number of days in overdue, past collections from customers, future collection amounts and the next payment due dates, credit insurance coverage, and promissory note amounts all slicerable by the names of individual sales reps.
Thus, in my quest to be liberated from frequent phone calls, I have implemented a daily AR monitoring system which reveals any overdue amounts as soon as they arise, utilizing standard SAP tables. By using Power Pivot, manual drudgery which could take at least a few days of intensive labor using vlookups to patch up awkward, cumbersome and error-prone “Frankentables” was gone forever, and a sleek comprehensive report that could be refreshed automatically was created.
After this, I spent six months doing daily reporting using Power Pivot which contained up-to-date AR information where it took me a maximum of 15 minutes per day – with this task becoming so repetitive that I could literally do it in my sleep. However, with tools like Power Update, (which was originally introduced here,) it is now possible to update this daily report without any manual intervention whatsoever!
Interactive Power BI dashboard on the web
Power BI provides a better platform for sharing data with sales reps who are frequently on the move visiting customers, than sending out Excel files.
In the interactive Power BI dashboard example below, I’ve included a selection of information relating to the AR and credit limits, Overdue balance, Past and future collections.
Tables used
For this example of a daily AR dashboard, I’ve created a fictitious database in the format of the following standard SAP tables:
Three fact tables:
- An accounts receivable open balance list (SAP’s FBL5N closing balance with today’s date)
- AR and Bank GL transaction list for a selected period (SAP’s FBL3N)
- Credit limit list (SAP’s FDK43)
Four dimension tables (the latter two tables are required if using a normalized customer table):
- A calendar table
- A customer master table
- An employee table (to be related to the customer master table’s salesperson key code)
- A world cities table with latitude and longitude data (to be related to the customer master table’s customer address location ID)
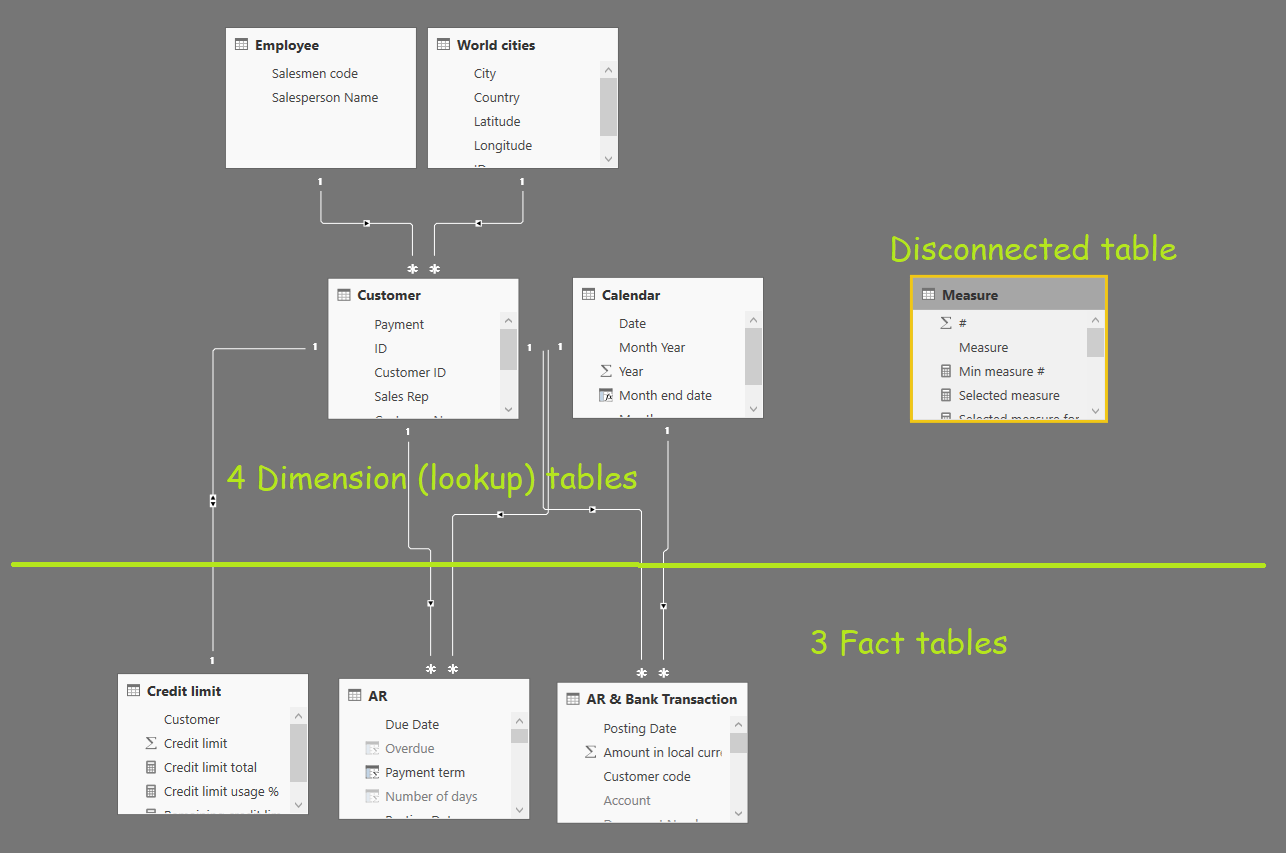
For this model, I created a relationship between AR[Due Date], ‘AR & Bank Transaction’[Posting date] and Calendar[Date]. I also created a relationship between the customer master table and the fact tables (AR, AR & Bank Transaction, Credit limit) using the customer keys.
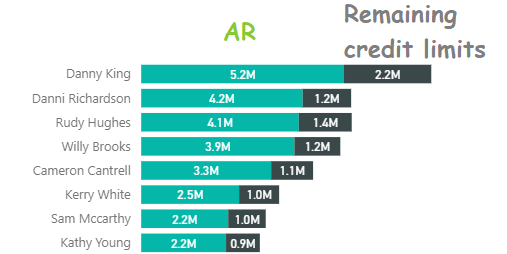
AR analysis
We’ll start with the AR analysis. This part will show the accounts receivable balance by customer with their credit limits. Salespeople can see the AR approaching its credit limit and take appropriate action (such as applying for an additional credit limit). I’ve stuck up measures for the current accounts receivable and remaining credit limits in the value field of the stacked bar chart.
AR =
IF ( SUM ( AR[Gross amount] ) = 0, BLANK (), SUM ( AR[Gross amount] ) )
Remaining credit limit =
[Credit limit total] – [AR]
Where the measure [Credit limit total] is just the sum of the amount field in the credit limit fact table.
Overdue analysis
I created a calculated column identifying the overdue AR amount:
AR[Overdue] =
IF ( AR[Today] <= AR[Due Date], 0, AR[Gross amount] )
Then totaled that up in a measure below:
Overdue amounts =
IF ( SUM ( AR[Overdue] ) = 0, BLANK (), SUM ( AR[Overdue] ) )
I then added a measure to identify the number of overdue days.
Overdue number of days =
VAR OverdueNumberofDays =
ROUND (
DIVIDE (
SUMX ( ‘AR’, ‘AR'[Overdue] * [Overdue days] ),
SUMX ( ‘AR’, ‘AR'[Overdue] )
),
0
)
& ” days”
RETURN
IF ( [Overdue amounts] <> BLANK (), OverdueNumberofDays, BLANK () )
Where
Overdue days =
VALUE (
IF ( HASONEVALUE ( ‘AR'[Today] ), VALUES ( ‘AR'[Today] ), BLANK () )
– AVERAGE ( AR[Due Date] )
)
Ideally, this part should show a nil value, but when the business has thousands of customers, showing a few customers here is quite reasonable. The fewer, the better, however. The business can take appropriate action such as contacting customers to ask for overdue payments.
I’ve also added a measure to identify the number of overdue customers.
Overdue customer distinctcount =
VAR OverdueCustomerDistinctCount =
COUNTAX ( VALUES ( Customer[Customer Name] ), [Overdue amounts] )
RETURN
SWITCH (
OverdueCustomerDistinctCount,
BLANK (), “No overdue”,
OverdueCustomerDistinctCount & ” overdue”
)
I then created a measure to put in the URL field of the image viewer custom visual to dynamically select a thumbs-up guy image or a thumbs-down guy image depending on the existence or otherwise of overdue customers. (I’ve omitted showing the full http address in the DAX code below.)
URL measure =
IF (
[Overdue customer distinctcount] <> “No overdue”,
“https://…omitted…/Thumbs-down-guy.png”,
“https://…omitted…/Thumbs-up-guy.png”
)
Past AR collections
In addition, we can assess the ability of the customer to pay by looking at the historical collection amounts. It is more useful to look at the actual historical cash collection amount for credit assessment than the sales amount which includes amounts which have not yet been converted into cash. For the past collection history, I’d get the other side of the bank journal entries using the AR and Bank journal entries transaction table (from FBL3N). Typically, AR and Bank journal entries consist of either sales and AR recording or AR clearing. In order to get the other side of the bank journal entries, I am using a calculated column formula which was kindly provided by Marco Russo in response to my last article.
‘AR & Bank Transaction'[AR clearing] =
LOOKUPVALUE (
‘AR & Bank Transaction'[Account description],
‘AR & Bank Transaction'[Document Number], ‘AR & Bank Transaction'[Document Number],
‘AR & Bank Transaction'[Year], ‘AR & Bank Transaction'[Year],
‘AR & Bank Transaction'[Account description], “Bank”
)
Then total up the AR clearing journal entries in a measure.
Past Collections =
– CALCULATE (
SUM ( ‘AR & Bank Transaction'[Amount in local currency] ),
KEEPFILTERS ( ‘AR & Bank Transaction'[Account description] = “AR” ),
KEEPFILTERS ( ‘AR & Bank Transaction'[AR clearing] = “Bank” )
)
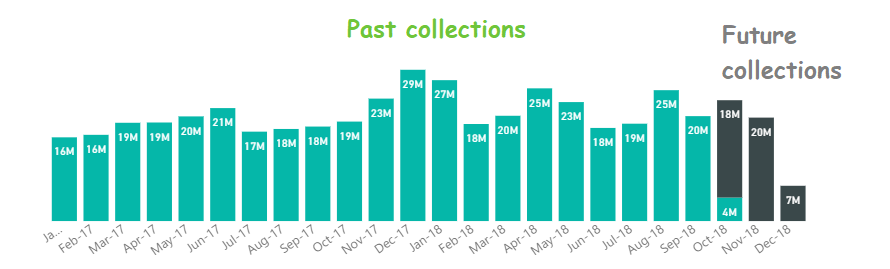
Future AR collections
In order to grasp the next collection amounts, I just use the measure [AR] without overdue amounts, as the latter were not paid by their due dates and thus should be excluded from the standard collection schedule by due dates.
Future collections =
[AR] – [Overdue amounts]
To show the past and future collections in the same time-series chart, I used a stacked column chart and put the two measures [Past Collections] and [Future Collections] in the value field.
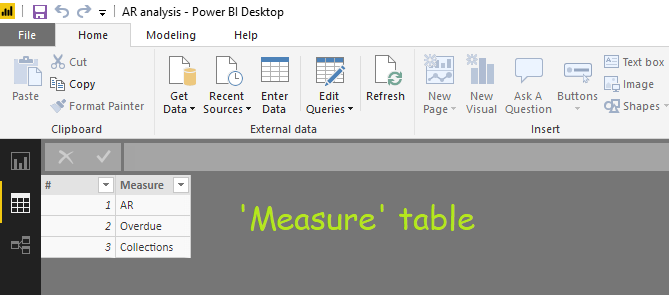
Dynamic scenario selections
Then, I used a “harvester measure” (covered in P3 Adaptive training) to enable different scenarios to be selected via slicers.
Selected measure =
SWITCH ( [Min measure #], 1, [AR], 2, [Overdue amounts], 3, [Past Collections] )
Where
Min measure # =
MIN ( ‘Measure'[#] )
The ‘Measure’ table is a small table of the three scenarios and remains as a disconnected table.
In a report to the salespeople, it is useful to have a search box feature to be able to input customer names (in a real business environment, a customer code is probably better, but I am using the text customer name in this example) and/ or the salesperson’s name. This becomes especially important when there are more than several dozen salespeople and several thousand customers, as we don’t want to be scrolling up and down the visual to look for a particular salesperson, or hover over the mosaic art as in the visual below to look for a particular customer’s name.

In the dashboard below, I used the Smart Filter by OKViz (i.e., sqlbi aka Marco Russo and Alberto Ferrari) and managed to cross out the top item in my long-standing wish list. Thanks to the great innovators, gone is the need to search for VBA codes to insert a slicer search box to efficiently select from several thousand slicer items.
For my overdue dashboard, many of the DAX formulas and their logic were quite straightforward. But the business impact of being able to systematically spot AR overdue amounts on a real-time basis has been huge. The timely monitoring of accounts receivable has prevented overdue amounts becoming uncollectable and prevented more goods from being sold to customers who missed payment due dates until the overdue amount is cleared albeit still within their credit limits. All in all, this can have a tremendous benefit to business by ensuring the timely conversion of AR into cash.
Salespeople can now monitor accounts receivable approaching their credit limit well in advance, so that they can take timely proactive measures such as applying for an increase in the credit limit or requesting customers to pay early for additional sales, rather than reacting in a knee-jerk manner in the event of sales being blocked by the system when the credit limit is reached.
Of course, the accuracy of the report depends on the timely and accurate recording and clearance of AR as we receive collections from customers. So sharing the information on a daily basis requires an accountant to maintain the AR transaction table with the most up-to-date information on a real-time basis, allocating collections as soon as they are received (on the same day) from customers, and addressing and clearing any discrepancies promptly.
Dramatic improvement
Thanks to Power Pivot, Identifying overdue balances on a real-time basis and dealing with issues in a timely manner has become a piece of cake for accountants. Now sales reps can get the real-time information they need without having to depend on accountants. As soon as a customer misses the due date, that is immediately flagged in the daily dashboard, enabling the business to take appropriate action in a timely manner. Power Pivot has provided us with real-time actionable business insights. This, in turn, has reduced the DSO and increased the cash balance of the company.
Even if there are more than several thousand customers in the master table, with the help of Power Pivot, the number of overdue customers at any one point in time can be reduced to less than the number of fingers on one hand as shown in the interactive dashboard above. Time after time, Power Pivot has proved to be a brainy and reliable ally for accountants!
Microsoft’s platform is the world’s most fluid & powerful data toolset. Get the most out of it.
No one knows the Power BI ecosystem better than the folks who started the whole thing – us.
Let us guide your organization through the change required to become a data-oriented culture while squeezing every last drop* of value out of your Microsoft platform investment.
* – we reserve the right to substitute Olympic-sized swimming pools of value in place of “drops” at our discretion.
