Data Ambiguity…The Silent Report Killer
Hello P3 Adaptive Nation, I’m excited to be back and writing a technical post again…it’s been too LONG! Today I want to talk to you about a real-world business problem and solution I encountered last year. I think it’s a scenario at least a few of you will relate to. I was working on a project for a client, and needed to create a Power BI report for them.
However, the client didn’t think the active filters in the report were easy to identify. Now this is a scenario I’ve encountered a few times over the years, whether it’s been in Power BI, Excel, or other reporting tools. Overall it comes down to this, data ambiguity can render a report A) Untrustworthy, B) Dangerous, or C) Useless. Personally, I think a well-designed Power BI report has clear “enough” call-outs on the filters. Truth be told though, it only partially matters what we think. At the end of the day, we need to cater the report to the client’s needs.
Please click here to download the workbook to follow along.
Typical report layout I create. Primary sections for – Headers, Slicers, Visuals/Tables:

“I Can See (Filters) Clearly Now”
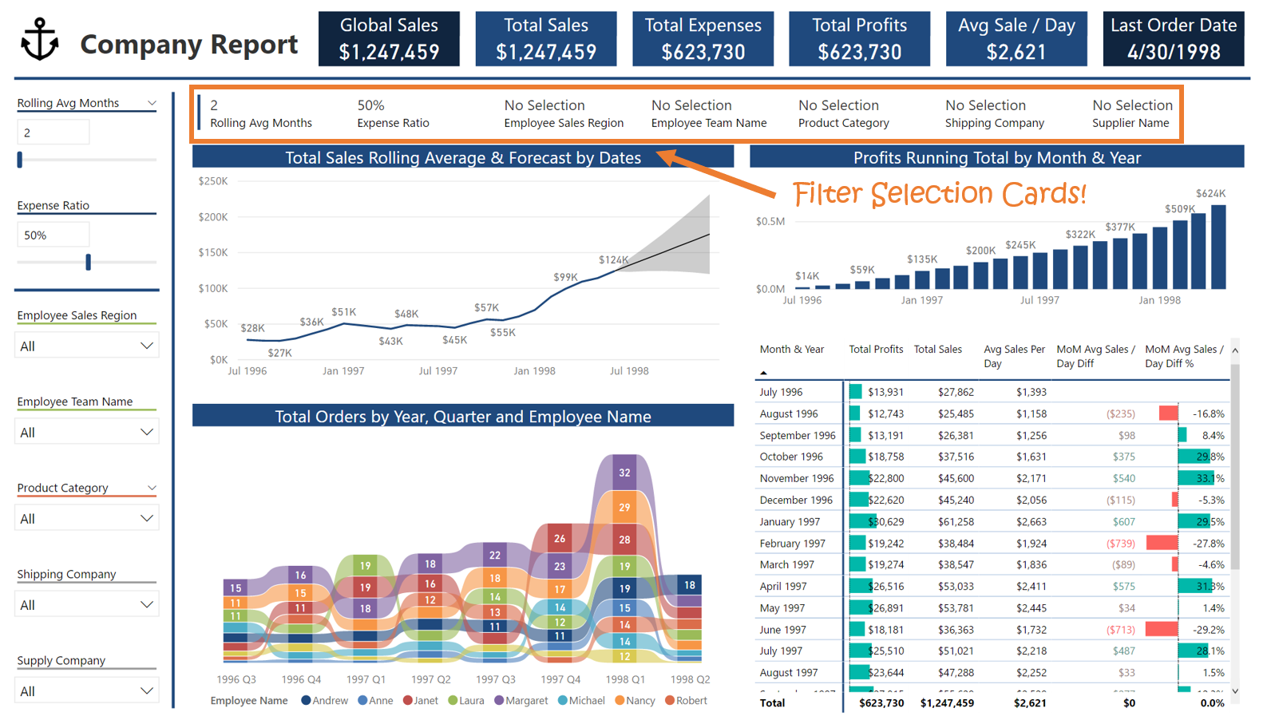
The client and I brainstormed, and we decided to create card visuals to identify filter selections. The beautiful thing about DAX, as mentioned in many articles on our site, is that it can easily return text values. I actually did something similar to this with Dynamic Titles when I posted about Power BI’s new Drill Through feature last year, that article can be found here. So, I essentially wanted to do something similar here, but to call out the filter selection for each slicer. The end result looked something like this
Same report with additional section for slicer filter selection:

The end result was a new section of the report, dedicated to calling out slicer selections. The BIGGEST reason the client wanted this, was for screenshots. They often took screenshots of this report, and pasted it into emails or slides to use in presentations. The result works well, and uses a bit of clever DAX to always return the right selections, no matter the combination of selections among the slicers.
DAX (SELECTEDVALUES) To The Rescue!
To get the right output with DAX I utilized one of the newer functions, Selected Values. Selected Values is used whenever you use the What If feature in Power BI Desktop. In fact…if you look at my screenshots above, the Rolling Avg Months & Expense Ratio What Ifs are attached to Selected Values measures. Selected Values works like this, you give it a column reference, let’s say [Column A]. If there’s a selected value (E.g. single selection) on that column, it returns that value. Otherwise there’s an alternative result returned. Here’s what the DAX Measure looks like for the Expense Ratio Value.
Expense Ratio Value = SELECTEDVALUE(‘Expense Ratio'[Expense Ratio], 0.50)
Selected Values is a fairly simple, and straight forward function. For a thorough and in-depth article on it’s uses and abilities, I’ll refer you to a post Marco Russo wrote over at SQLBI. I figured I could use this function to point to my slicer columns, and return a “No Selection” alternative result if there wasn’t. I thought that’s all I’d need, just rinse and repeat a bunch of Selected Values measures, and I’d be done! Not quite…I noticed a few issues after I did this.
Filter Issue Number One
I quickly realized that I was getting false positive filter selections when using certain slicers. As an example, whenever I made a specific selection on Employee Sales Region, sometimes the filter selection for Employee Team Name would change too! What was happening is there was a Sales Region with only a SINGLE Team name. It was triggering the Selected Value logic, because only a SINGLE VALUE was being given to it.
False positive filter selection, despite no selection on the slicer:

I needed my DAX measure to run ONLY when there’s an ACTIVE filter on the column. Selected Values doesn’t check to see if the column has an active filter on it, instead it’s only checking to see if there’s a single value from that column. Some additional business logic would need to be applied to it, to FIRST check for active filtering BEFORE running the Selected Values logic. I worked through a few variations, and eventually ended up using the DAX Function ISFILTERED.
Employee Sales Region Selection = IF( ISFILTERED(‘Employee Details'[Employee Team Name]), SELECTEDVALUE(‘Employee Details'[Employee Team Name], “No Selection”), “No Selection”)
Filter Issue Number Two
ISFILTERED worked, and I no longer got a false positive filter selection! However, further testing unveiled a second problem. The other issue aired its ugly head whenever a slicer had multiple selections on it. Now my DAX is returning a false negative! I want it to return “Multiple Selections” if I have TWO or more slicer selections. This will be an easy enough fix actually.
The Employee Sales Region Selection DAX (above) has two conditions it’s checking. Condition one (ISFILTERED) is checking if there’s an ACTIVE filter on the column. If that condition is met, then it checks condition two (SELECTEDVALUES), which checks to see if there’s only ONE value coming from that column. If that second condition isn’t met, it returns “No Selection” at the inner most part of the query. All we have to do is update the alternative result in condition two, and change it to “Multiple Selections“.
Employee Sales Region Selection = IF( ISFILTERED(‘Employee Details'[Sales Region]), SELECTEDVALUE(‘Employee Details'[Sales Region], “Multiple Selections”), “No Selection”)
BEFORE – Multiple selections on the slicer, but no indication of filters on the card:

AFTER – Multiple selections on the slicer, Multiple Selections indicator on card:

It’s also possible to return the entire list of selected values, instead of “Multiple Selections”. In fact, Rob has a great post on how to do JUST THAT. It utilizes a DAX Function called CONCATENATEX, and I’d recommend giving it a read. I didn’t go that route, as the client was happy just having multiple selections as the output for this scenario. There you have it folks, a great way to add a bit of clarity to your report. In case youever need a really obvious call-out for your slicer selections. I’m glad to be back in the technical saddle a bit on post writing, look forward to some more posts from me this spring!
Microsoft’s platform is the world’s most fluid & powerful data toolset. Get the most out of it.
No one knows the Power BI ecosystem better than the folks who started the whole thing – us.
Let us guide your organization through the change required to become a data-oriented culture while squeezing every last drop* of value out of your Microsoft platform investment.
* – we reserve the right to substitute Olympic-sized swimming pools of value in place of “drops” at our discretion.
