
Forecasts Anticipate Trends within Large Populations, On Timelines Typically Measured in Months or Years.
Predictive Analytics Anticipate the Behavior of a Single Individual, Often on a “Right Now” Timeline.
We’ve Seen Some Confusion On Forecasting vs Predictive Analytics – and It’s Understandable
It may sound like silly semantics at first, making a distinction between two synonyms like “forecast” and “predict.” And silly semantic differentiations ARE one of my personal pet peeves – Chris Rock’s famous distinction between “rich” and “wealthy” is one example that did NOT bother me, because he used it as a device to CREATE an important distinction. But we’ve all been lectured at one time or another by someone taking two previously-interchangeable words and pretending that there has ALWAYS been a sharp distinction between them… in an effort to make themselves look much smarter than they are (or more importantly, smarter than their audience).
So I’m NOT here to rewrite the English language – “predict” and “forecast” ARE synonyms in the dictionary sense, and will remain so. In fact their interchangeability in normal parlance is the REASON why companies end up frequently buying the wrong analytical product or service.
But in the analytics world, there ARE two very different kinds of activities hiding behind these synonyms, and it’s important not to buy one when you actually need the other. You can end up five-to-six figures deep in the wrong thing before you discover the mistake. I want to help you avoid that, hence this article.
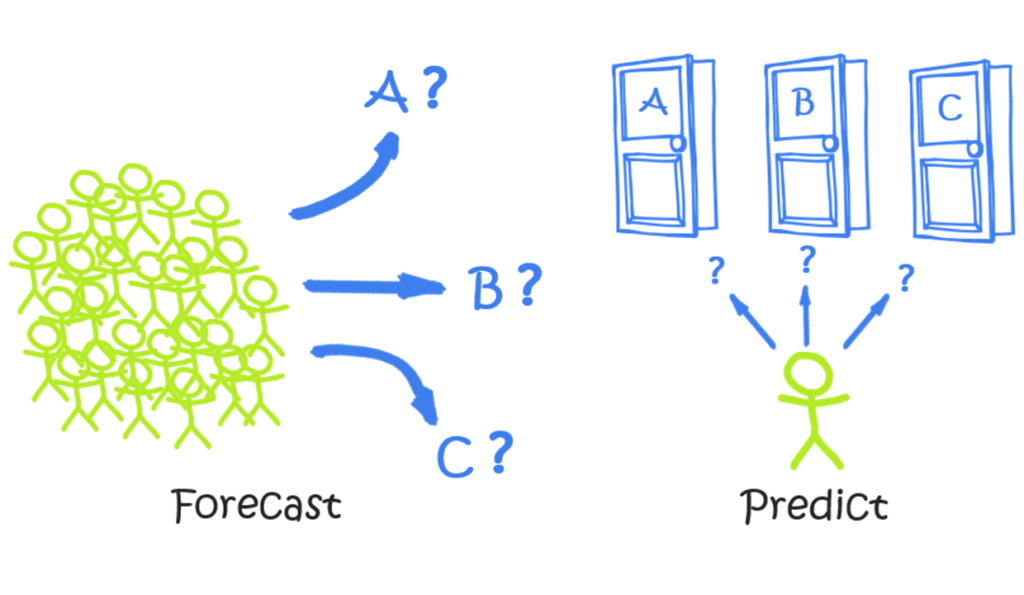
The Picture IS Worth a Thousand Words
Once you’ve digested the illustration at the top of this article, yeah, you’ve kinda already got it.
-
Forecasting is when we anticipate the behavior of “Lots” of people (customers, typically) on “Long” timelines.
-
Predictive Analytics anticipate the behavior of One person (again, typically a customer) on a “Short” timeline.
So… Macro versus Micro.
But let’s delve just a little bit deeper, in order to “cement” the concepts. Examples will help, so let’s…
Pretend We Are Facebook!
Like many modern organizations, Facebook benefits from a mixture of both Macro and Micro. They certainly have need to Forecast the trends in their overall business, as well as the need to Predict the behavior of individual users. Let’s illustrate with some examples.
Examples of Forecasting Questions at Facebook
-
“How many active users will we have at the end of this year?”
-
“Three years from now, what % of our revenue will come from mobile devices as opposed to PC’s?”
-
“How much are we going to spend on server hardware next quarter?”
These are all quite valid and important questions to answer. They impact strategic planning and guidance provided to investors – about as crucial as you can get, really.
They also all tend to blend human inputs with computational power to produce their answers. We use data and software as extensions of our brains – very often in a collaborative effort across multiple people (sometimes a handful, sometimes hundreds or more). In other words, these aren’t the sort of things we hand to machines to handle in a fully-automated manner (at least, not today).
Types of Activities in Forecasting
The simplest form of forecasting is the “lowly” line chart:

Line Charts are an EXCELLENT Forecasting Tool – As Long as the Trend is Smooth and Obvious
(Unless Some Big Structural Change is Coming, It’s Not Hard to Guess Where THIS Trend is Headed)
Of course, trends aren’t always so smooth and obvious. Try this chart instead:

“Choppy” Trend: Not NEARLY as Obvious What the Next Few Months Will Look Like, So Now What?
When faced with a non-obvious trend (and most trends are NOT as obvious as the first example), here are some progressively-more-sophisticated approaches:
1) Add an automatic trendline to the chart.
This SOUNDS sophisticated, but the algorithms behind automatic trendlines are, by necessity, quite primitive in most cases. EX: They can’t tell the difference between a one-time exception and a significant new development. For instance, is August 2016 (the big spike in the red chart above) due to a one-time influx of revenue from a source that won’t surface ever again, or representative of a breakthrough in the core business? Trendline algorithms aren’t typically sophisticated enough to tell the difference – and that’s a GOOD thing, because if they started making assumptions about such things, they’d be WILDLY wrong at times – without warning.
Here’s another way to say it: when a trend is obvious, WE can draw the trendline with our eyes. But traditional computer-generated trendlines aren’t much better. They do basically the same thing that our eyeballs do – they “split the difference” mathematically amongst the known historical points in order to draw a line (or curve).
2) Build a smarter trendline with a combination of biz knowledge and formulas.
Ah, now we’re getting somewhere! And we do this sort of thing ALL THE TIME with our clients, since DAX (the Excel-style formula language behind Power BI and Power Pivot) is an absolute godsend here. Let’s factor in seasonality for instance – take how strong our biz has been this year versus the prior year, for instance, and then multiply that by the seasonal “weight” of January (calculated from our past years’ historical data) and we’ll arrive at a much more intelligent guess for January than our auto-trendline would have generated.
And, as humans, we may know quite a bit about that August 2016 spike. Let’s say a bunch of that revenue came from a one-time licensing deal – something that we cannot responsibly expect to happen again. Well, a quick usage of the CALCULATE function may be all that’s required – we’ll just remove licensing revenue from consideration while building our smarter trendline formula.
3) Decompose the overall trend into sub-trends.
Just like in my article on The Ten Things Power BI Can Do For You, (and the live presentation version on YouTube), DECOMPOSITION is an incredibly powerful weapon, and arguably a necessary one. If you break your overall trend out by Region, for instance, it may be easier and more accurate to forecast each Region individually, and THEN re-combine all of those “sub-trends” to come up with a macro trend forecast. Again, this is something we have done a lot of with our clients, and the Power BI / Power Pivot toolset is fantastic in this capacity.
4) Incorporate external variables.
We often get so caught up in our businesses as being Our Everything, so it’s good to take a step back and remember that the outside world has at LEAST as much influence on “what’s going to happen” as our internally-focused trends and behavior. In our Facebook example, for instance, knowing whether China is likely to suddenly allow Facebook to operate there would be a big deal. But in a more mathematical sense, even knowing how many children will be “coming of Internet age” in the next year is an important external variable, since they represent potential new Facebook users. Similarly, the number of people in developing countries “coming online” as cellular and broadband infrastructure reaches them is also relevant. You can take important factors like those (as well as expected conversion rates – what % of those new Internet users will become Facebook users?) and mathematically incorporate them into your forecasting models, especially a “sub-trend” model, to arrive at an ever-more-refined estimation of the future.
5) Involve the Humans!
Given the intricacies of the sub-trends approach, it makes sense to “subcontract” each sub-forecast to a specific person or team who knows it best, have them mathematically blend internal trends with external variables, and submit their forecasts back up to you. This allows the formulas used to be quite different in each sub-segment, to reflect the very-different realities of each segment.
This may sound chaotic, and in larger orgs, it definitely CAN be. But our friends at Power Planner have an AMAZING system that works in tandem with Power BI when it comes to collaborative forecasting and budgeting. We’re using it right now to help several of the world’s largest corporations develop an ever-more-accurate picture of the future.
Wrapping Up Forecasting
I think that’s enough about Forecasting for such a high level article. I want to move on to Predictive, and then a parting observation.
So let us know if you’d like to know more about Forecasting in Power BI – whether you want to perform that in a top-down fashion or bottom-up, we’ve got the experience.
Examples of Predictive Analytics at Facebook
")
Forecasting = “How Heavy Will The Traffic Be Next Month?” Predictive = “Will the Yellow Car Get Off at the Next Exit?”
Here are some Predictive Analytics examples that are critical at Facebook:
-
Of our millions of advertisements, which one should we show to user X right now?
-
When User X is logged on via a Mobile Device vs. a PC, should we change up our ad mix, or is their behavior consistent across platforms?
-
What’s the optimal ratio for “real posts” to ads in User X’s news feed (optimal in terms of ad clickthrough rates)?
The difference in these examples leaps off the page – we’ve “zoomed in” on a single user/customer, and we’re making a decision/adjustment in real-time (or near-real-time).
But before we dive a bit deeper into HOW you do this stuff, let’s address a common question we get at this point…
“OK, but can’t we take a bajillion ‘micro’ Predictions and roll them up into a ‘macro’ Forecast?”
It’s a fair question that smart people ask: if you get really good at micro-level Predictive, can’t you dispense with macro-level Forecasting altogether? Well, no. Let’s drill down on that first example – the “which ad should we show User X right now?” example, to illustrate.
(As we answer this question, we actually start to answer the “How Does One DO Predictive?” question as a bonus!)
In order to predict which ad is most-likely to “succeed” with User X, your Predictive systems need to know some things:
1) Detailed attributes of User X are a Must-Have Input for Predictive.
The obvious stuff like age, gender, and location for starters. But also… their history of what they have Liked. Articles they have clicked through to read more. Ads they have clicked. Their Friends Lists, and the Like/Ad behavior of them.
2) Historical behavior of similar users is a tremendous help for filling in gaps.
Let’s say User X has only been on Facebook for a week, and we don’t have really sufficient ad-click history on them yet. But in that week, we’ve already seen quite a bit of them in terms of Like behavior and Article Clickthrough behavior. Combine that one-week snapshot with their basic demographics, and we can quickly guess that they are quite similar to “Audience XYZ123” – a collection of users with similar Like and Clickthrough behavior, and now we can lean on THEIR longer-term histories of ad click behavior to get a good guess of what sorts of ads User X will click.
3) Oh yeah, we also need the detailed attributes of the Ad in question! I
s it video or static? Who is the advertiser TRYING to reach? What are the associated keywords? In the time we’ve been running this Ad, who has been clicking on it and who has not?
4) Predictive Analytics systems NEED to make mistakes.
Predictive systems are constantly refining their guesses based on failure. Let’s say we think our “one week old” User X is gonna love a particular Ad based on their striking similarity to Audience XYZ123, so we serve that ad up, and not only does User X not click the ad, they actually click the little X that says “never show me ads like this again.” Does our Predictive System give up and stop making guesses for User X? Heck no! Instead it’s in some sense thrilled to get this feedback, and uses it to start developing a more-accurate picture of User X. Over time our system may even “discover” that it should “fork” Audience XYZ123 into two splinter factions – one like User X, and one that more closely-resembles the original picture of Audience XYZ123.
In short, it’s worth summarizing and emphasizing…
-
In order to make micro-level Predictions, you require a MASSIVE amount of detailed information, AND…
-
You need to be able to make, and learn from, mistakes.
Predictive Analytics are Automated – Humans Have Little Role (Once the System is Running)
Predictive s ystems operate without direct human intervention. This is in direct contrast to Forecasting, which, while highly mathematical and assisted by software, benefits GREATLY from direct human insight and input. Sure, in a Predictive system, there might be some high level “knobs” that you can adjust to make the system more or less aggressive for instance, but each individual prediction happens without a human being consulted.
This is where Machine Learning, AI, and R shine. Whereas DAX is fantastic at Forecasting, it really has no role to play in Predictive (except as an adviser in turning those high-level knobs mentioned in the prior paragraph).
This is why Microsoft has rapidly expanded its analytics offerings. Rewind 24 months and Power BI is basically all you were hearing from Mount Redmond. But in very short order, we now have HDInsight and Azure Machine Learning making some serious waves in the marketplace.
“Hey, you never answered the question: ‘if we master the micro, haven’t we ALSO mastered the macro?’”
Let’s start here: how many chances do you get to be wrong in a Macro-Level Forecast?
One. You get One. “Q4 2017” only happens once, full stop. Machine Learning systems need to experiment, fail, and improve. But when it comes to Forecasts, YOU don’t get a chance to learn from mistakes – fail badly enough and you’re out of a job. Assume that Q4 2017 is gonna look just like all of the Q4’s past at your own peril – but even if we DID do that, we wouldn’t need a sophisticated Predictive system to do so, would we?
Next, do you have all of the micro-level detail required?
Nope, not even close. For starters, you’re gonna have new customers next quarter. And you know NOTHING about them yet, not even the basics of their individual demographics. And remember, I’m not talking about broad trends here, I’m talking about hyper-detailed information on each individual customer – THAT’S what you need for a Predictive system to function. Oh, and perhaps even MORE importantly, you don’t know what Ads are going to be submitted by your advertisers next quarter (sticking to the Facebook example for a moment).
So, you can’t Predict your way to a Forecast, but also: Forecasts need to be Explainable.
Imagine telling Wall Street that we expect 15% revenue growth next quarter. They ask why. And we say “um, our Machine Learning system said so, but we really don’t understand why.” That’s not gonna fly, but that’s precisely the best you can do really. Predictive systems are far superior to human beings at their task precisely because they are INhuman. If they could explain their predictions to us and have us understand, we wouldn’t have needed them in the first place.
So here’s an, ahem, prediction from me: Forecasting will remain a “humans assisted by DAX-style software” activity until we eventually develop General AI. As in, the kind that eliminates ALL need for humans to work. The kind we’re scared might just flat-out replace and discard us, or might usher in an era of unimaginable human thriving. Either way, when we get to that point, our problems of today are no longer relevant.
In the meantime, we can still do AMAZING focused things with Predictive Analytics. Not every organization has a need for it yet (or is ready for it yet, more accurately), but chances are good that your org DOES. If you want help getting started with HDInsight and/or Azure Machine Learning and related technologies, let us know and we’ll be glad to help.
