Here are 2 tips for visualizations in Power BI Dashboard. In Power BI service (PBIS) there are reports. But there are also dashboards. Dashboards are sites to pin key visuals. People can view but not interact with them. They can click through, but not scroll or drill down. For more about dashboards, see Microsoft’s docs.
Pin layered visualizations in Power BI dashboard.
Sometimes, I layer two visualizations in Power BI Desktop. This lets me put more details in the same space.
However, we can only pin the top layer to a dashboard in Power BI service.
My solution is to layer visuals on a page in Power BI Desktop and pin that page. This page will be similar to a tooltip page, which Reid blogged about earlier in the year.
Below, a card shows total sales on top of a donut chart of sales by category.
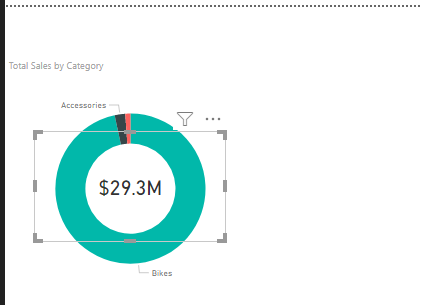
Then, I copy the visualizations to a new page.
Click on an empty space in the canvas. Then, go to Formatting.
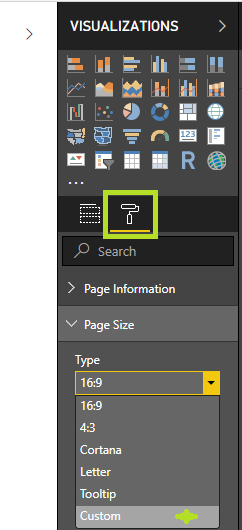
From here, set page size as Custom.
Next, size it to the images.
And then publish the report to Power BI Service.

Instead of pinning one of the visualizations to the dashboard, pin the live page.
Behold the hidden tooltip-style page.
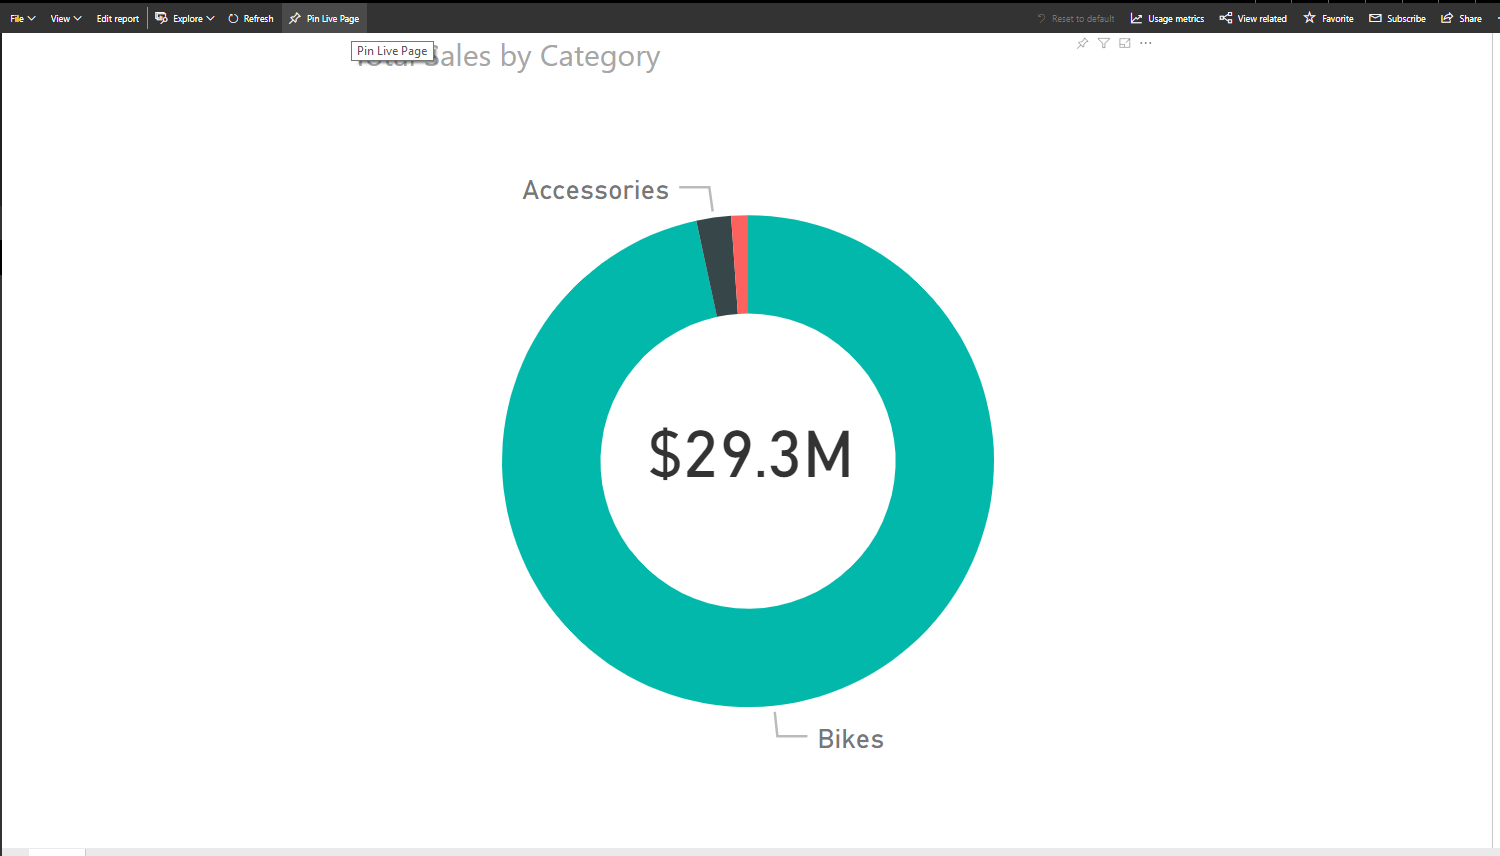
Hide the title.
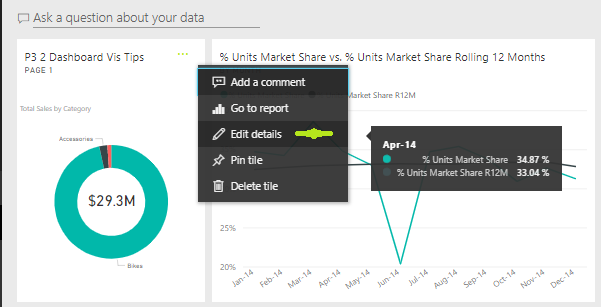
As a result, we see layered visualizations in Power BI dashboard.
Add image visualizations in Power BI dashboard without a link.
You can pin images in Power BI dashboard– great for branding.
However, images must be links. Links may break. Also, I got the authentication blues with hosting in OneDrive for Business.
My solution is to add images as binary.
So, the secret is that you can use any URI not just links. A URL is a Uniform Resource Locator, while a URI is a Uniform Resource Identifier. Instead of linking to the image, we’ll embed it in the link.
I remembered a post by SQLJason about Base 64 images in Desktop. In that post, Jason Thomas uses Base 64 to hard code images.
First, encode your image. Use an online image converter, like this one. When you upload the image, you’ll get a text string.
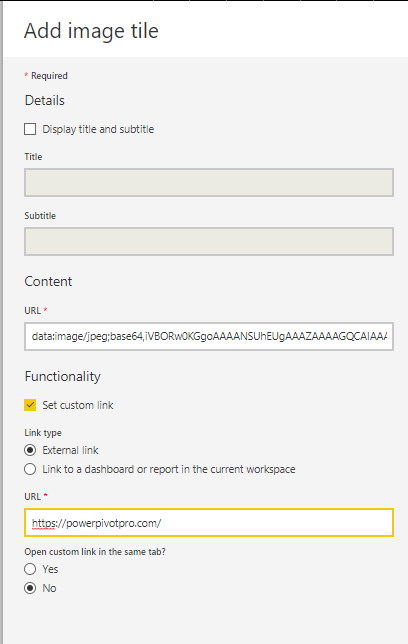
Second, add image tile to the Dashboard.

Third, paste the text string. These can be long. And I don’t know the limit. Thus, it may not work for high res images.
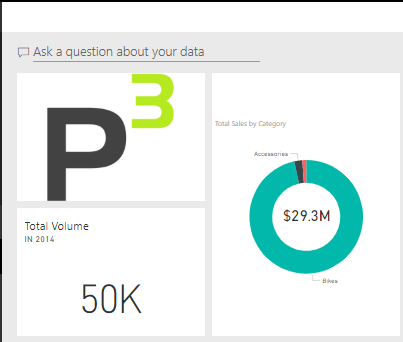
As a result, the image is on the dashboard. This image won’t break. Likewise, it won’t update.
Power BI can also code images. Here’s Gerard Brueckl’s blog post.
Microsoft’s platform is the world’s most fluid & powerful data toolset. Get the most out of it.
No one knows the Power BI ecosystem better than the folks who started the whole thing – us.
Let us guide your organization through the change required to become a data-oriented culture while squeezing every last drop* of value out of your Microsoft platform investment.
* – we reserve the right to substitute Olympic-sized swimming pools of value in place of “drops” at our discretion.
