In This Case, Getting the Grand Total Correct for Each Row Required SUMX
It’s that time of year again…
…when my love of spreadsheets actually translates into a love of sports. Yes, it’s Compulsive Data Crunching Disease season, AKA Fantasy Football Season.
Fantasy football is a game in which the contestants assemble “portfolios” of NFL players in the same manner that you might build a portfolio of stocks and bonds. Then your portfolio (we call it a “team”) performs well if the real-life NFL players perform well, and poorly if not. The one difference between this and the stock market is that no two “portfolios” can contain the same NFL player – so if I get Peyton Manning, the other contestants in my league (typically 8-12 people) cannot have him.
I’m participating in a new form of league this year, one in which the contestants get to keep some of the players from prior years. (In most fantasy football leagues, you start each year from a clean slate).
We’re going to be picking our players this weekend at an “auction” or “draft,” and naturally, I want to scout my opponents ahead of time. Muhaha.
So, what do my opponents need?
A valid portfolio consists of:
- 1 real-world NFL quarterback (QB)
- 2 running backs (RB)
- 2 wide receivers (WR)
- 1 tight end (TE)
- 2 “Flex” players (can be RB or WR or TE)
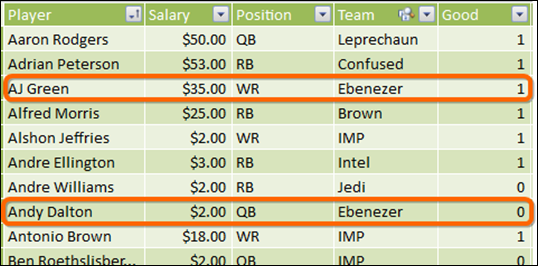
So, given this table:
This Table Reflects the Existing Portfolios – My Team is Ebenezer
AJ Green, a WR, is Predicted to be Very Good This Year, So I Marked Him as Good=1
Andy Dalton, a QB, is Expected to be Mediocre, So Good=0
I want to tally up how much each team needs to “acquire” in this weekend’s auction event.
You still with me? I hope so, because now is where the DAX starts.
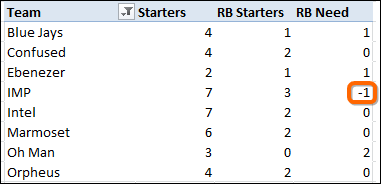
A few quick measures and we have:
Pretty Straightforward Start (Formulas Below)
But I Don’t Like That -1
[Starters]:=
SUM(Rosters[Good])
[RB Starters]:=
CALCULATE([Starters], Rosters[Position]=”RB”)
[RB Need]:=
2-[RB Starters]
Why “two minus?” Because the league rules say we need 2 RB’s, that’s all.
Negative Need Does Not Make Sense, so We Add an IF()
That last measure, [RB Need], I don’t like. Once a team has 2 of any position, they are “full” and don’t need any more. Yes, they can exceed that, and stash the extra players in reserve, but for my purposes, you cannot “need” less than zero. No negative numbers allowed, please.
So we modify the measure to be…
[RB Need]:=
IF([RB Starters]>2,0,2-[RB Starters])
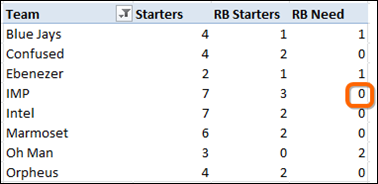
Perfect. If you already have more than 2, you’re at 0 need:
No More Negative Value for Need ![]()
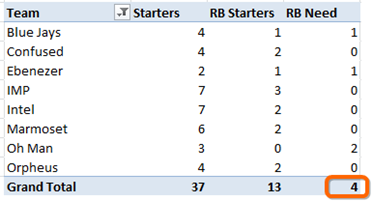
But Now the Grand Total is Wrong!
The IF Returns 0 for the Grand Total, Because [RB Starters] is 13 in that Context
Ah, so now we change the measure to:
[RB Need]:=
SUMX(VALUES(Rosters[Team]),
IF([RB Starters]>2,0,2-[RB Starters])
)
Which is just the original IF “wrapped” in a SUMX(VALUES()). For more on SUMX, see the 5-Point Palm Exploding Function Technique. For more, on VALUES, see this recent post.
And voila, all problems fixed:
Everything is Now “Happy”
A Few Points of Perspective
1) I always struggle to find good examples of using SUMX to force totals to add up correctly. Usually the examples I find when I am on the spot feel kinda… dirty. Like we are cooking the books or something. But there are MANY legitimate needs for it – needs that are always super specific to the domain at hand, like the one above.
But I do think “need” is a pretty good example. Any arithmetic operation where you want to round negative numbers up to zero will probably result in incorrect subtotals and grand totals. So maybe I have found a good example here?
2) This is another example of using Power Pivot for a small, single table. I didn’t use Power Pivot for this problem just because of habit. I used it because it is BETTER – it took me less time than regular Excel and allows me the benefits of portable formulas (so I can rearrange the pivot, build alternate views, etc. without writing new formulas).
For another example of using Power Pivot on a small single table, see 1 Table, 50 Rows, 7 Columns: Analyze with PowerPivot? You Bet!
3) For some reason, SUMX of an IF just strikes me as damn cool. I can’t put my finger on it, but it seems like the perfect blend of old and new, of simple and sophisticated. Do you get that same vibe?


