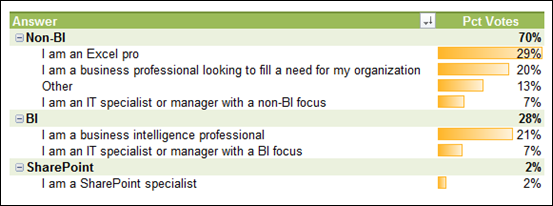
Even though it is still open, the one-question poll results have stabilized. In fact, the percentages were pretty stable even from the beginning.
When I first “opened” the blog more than two years ago, the readership was overwhelmingly “BI” plus a smattering of SharePoint folks. There weren’t enough Excel folks aware of PowerPivot to really even register back then.
The growth of the Excel audience here from essentially zero to approximately 70% of the readership actually parallels, perfectly, the total growth in page views.
Makes sense. If you are part of the Microsoft BI community, you heard the PowerPivot message early and often. The Excel audience is MUCH harder to reach, and has had to discover PowerPivot via social/viral means.
Non-BI = Excel?
Yeah, is that a stretch? I don’t think so, not at all. If you are crunching numbers and you are not BI, what are you? Excel, that’s what. Or working/researching on behalf of an Excel audience.
What about “Other?” Those answers were overwhelmingly Excel-focused, too. Here’s a sample:
One Last Note
How did I perform the analysis? Why, I exported to Excel of course ![]()
…and then into PowerPivot.


Your email address will not be published.