A Power BI Technique Mined from the Power Pivot Archives
Below, you will find one of our all-time favorite Power BI techniques. In the ten (yes ten) years we’ve been operating this site, we’ve written over 1,000 articles on Power BI. Hard to imagine - even for us - but true.
Years ago, we first wrote up this technique in the context of Power Pivot – Power BI’s cousin and predecessor, which we like to call “Power BI in Excel.”
Since the two products share the same brains (DAX and M), this technique is more relevant today than ever. Everything below is 100% legit for Power BI – the same data model “shape,” the same DAX, etc. – but now you can use it to power up your Power BI visuals, and not just PivotTables. Enjoy!
“AGAIN!”
-Pai Mei
SUMX() – the great iterator
Have you ever written an array formula in Excel? (Don’t worry, most people haven’t). Have you ever written a FOR loop in a programming language? (Again, don’t worry, there’s another question coming). Have you every repeated something over and over again, slowly building up to a final result?
That’s what SUMX() does. It loops through a list, performs a calc at each step, and then adds up the results of each step. That’s a pretty simple explanation, but it produces some results in pivots that are nothing short of spectacular.
Anatomy of the function
SUMX(<Table>, <Expression>)
THE BRIDE: “What praytell, is a five-point palm, exploding function technique?”
BILL: “Quite simply, the deadliest blow in all of the analytical martial arts.”
THE BRIDE: “Did he teach you that?”
BILL: “No. He teaches no one the five-point palm, exploding function technique.”
That’s kinda how I feel about the description of SUMX in the Beta release: “Returns the sum of an expression evaluated for each row in a table.” It merely hints at the power within.
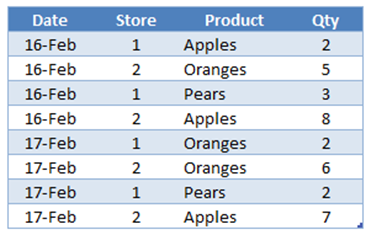
Oddly, the best way to show you what I mean is to start with some useless examples and then build up to useful ones. For all examples, I will use the following simple table, Table1:
Useless Example #1: By the whole table
SUMX(Table1, Table1[Qty])
Returns: 35, which is the total of the Qty column. Might as well just use SUM([Qty]).
Why: Well, it iterates over every row in Table1, and adds up [Qty] at each step, just like the description says it would.
Useless Example #2: By a single column
SUMX(Table1[Product], Table1[Qty])
Returns: An Error
Why: Table1[Product] is not a Table, it’s a Column. And SUMX demands a Table as the first param.
Useless Example #3: By distinct values of a column, sum another
OK, I’ll wrap the [Product] column in DISTINCT(), since that returns a single-column table:
SUMX(DISTINCT(Table1[Product]), Table1[Qty])
Returns: An Error
Why: [Qty] is not a column in the single-column table DISTINCT([Product]). Only [Product] is. Why did I even try this?
That’s where I gave up awhile back. Until I learned…
Almost-Useful Example: The Second Param Can Be a Measure!
And even better, that measure CAN access other columns even if you use DISTINCT. First let’s define a [Sum of Qty] measure:
[Sum of Qty] = SUM(Table1[Qty])
And then re-try the previous example with the measure, not the column:
SUMX(DISTINCT(Table1[Product]), [Sum of Qty])
Returns: 35 Yes, the total, again. But this time, the “Why” is worth paying attention to.
Why: Let’s step through it. Remember, for each value of the first param, SUMX evaluates the expression in the second param, and then adds that to its running total.
Step One: SUMX evaluates DISTINCT([Table1[Product]) which yields a single-column table of the unique values in [Product]:
Step Two: SUMX then filters the Table1 (not just the [Product] column!) to the first value in its single-column list, [Product] = Apples.
Then it evaluates the [Sum of Qty] measure against that table, which returns 17.
Steps Three and Four: The process repeats for Oranges and Pears, which return 13 and 5:
Last Step: SUMX then adds the three results it obtained: 17, 13, and 5, which yields 35.
A lot of work to get the same result that the [Sum of Qty] measure can get on its own, but now that you know how it operates, let’s do something else.
And now, the Useful Example!
Let’s define another measure, which is the count of unique stores:
[Count of Stores] = COUNTROWS(DISTINCT(Table1[Store]))
For the overall Table1, that returns 2, because there are only 2 unique stores.
Let’s then use that measure as the second param:
SUMX(DISTINCT(Table1[Product]), [Count of Stores])
Step One: same as previous example, get the one-column result from DISTINCT:
Step Two: filter to Apples, as above:
…and the [Count of Stores] measure evaluates to 2 – 2 unique stores have sold Apples.
Step Three: Oranges
…again, the measure evaluates to 2. 2 unique stores sold Oranges.
Step Four: Pears
…hey look, only one unique store sold Pears. So the measure evaluates to 1 here.
Last Step: Add them all up. 2 + 2 + 1 = 5. SUMX returns 5. This basically means that there are 5 unique combinations of stores and products that they sell.
Why is that useful?
Well, I can’t share the precise case I was working on, because it belongs to a reader’s business. But trust me, you are going to find yourself wanting this sooner or later.
Things to keep in mind
- SUMX responds to pivot context just like anything else. So if you slice down to just a particular year, your results will reflect only what Stores sold in that year.
- AVERAGEX, MINX, MAXX, and COUNTAX all work the same way. So if you want to iterate through just like SUMX but apply a different aggregation across all of the steps, you can. Those would return (5/3), 1, 2, and 3, respectively in our example.
- The fields referenced in SUMX do NOT have to be present in your pivot view. In my case, SUMX was working against [Store] and [Product]. But my pivot could just be broken out by [Region] on rows and sliced by [Year], and the measure still works. (I like to think of it as a stack of invisible cells underneath each pivot cell that you can see, and SUMX is rolling up a lot of logic across those invisible cells to return a simple number to the top cell you can see.)
More to come!
Yeah, I am not even done with SUMX. Like Jules told you, it’s some serious gourmet DAX 🙂
Super-cool, but why does SUMX behave differently when the second param is a measure? You show it filtering the table revealing the other table columns in the almost-useful example – but why does this not happen in example 3?
I had the same head-scratching moment. In fact, if example 3 had worked for me the first time I tried it, I would have discovered examples 4 and 5 sooner.
I suspect that no matter how much we select and filter, measures ALWAYS have access to all of the columns. But columns are either there or they are not. We’ll have to test that theory on other cases to see if it is true.
As intrepid explorers of the new frontier, I now realize that we are halfway learning DAX, and halfway discovering it. It’s simply way too rich for any one person to grasp entirely yet, even for members of the product team.
I think that this is one of the most significant DAX posts to date. I have a lot of measures using SUMX. I’ve struggled to work out some of these measures (and got help with many of them) because the crucial facts about the inner workings of SUMX have never been well documented (until now). Thanks a million.
I’ve observed that folks on the DAX team have a preference for using VALUES in SUMX formulas (except in measures that use COUNTROWS). Although I understand how VALUES work, I find it to be one of the most unintuitive names for a function that I’ve come across. There’s no hint in the name that the function has anything to do with distinct values. If the only difference between VALUES and DISTINCT is that VALUES handle unknown members, could this not have been a parameter in the DISTINCT function? OK, OK, this is a topic for another discussion 🙂
[…] a sum of Table1[amount] over a filtered table, more on sumx at this blog post of Rob […]
[…] a sum of Table1[amount] over a filtered table, more on sumx at this blog post of Rob […]
[…] the MIN function, the function MIN only takes a column, not a measure. So again we resort to the The 5-point palm, exploding fxn technique in this case […]
[…] a DAX function that needed the The 5-point palm, exploding fxn technique as described by Rob in his PowerPivotPro blog post. I have used SUMX and COUNTX with success a few times before but this time I had a hard time […]
[…] had a problem that needed The 5-point palm, exploding fxn technique as described by Rob in his blog post. I have used SUMX and COUNTX with success a few times before but this time I had a hard time […]
[…] CALCULATE, ALL, and maybe even SUMX (in that order!) before digging into the DAX chapters. The book introduces those functions in […]
[…] be a MAX at the lowest level of the pivot but then a SUM at higher levels? If so, I recommend you try SUMX […]
Hi, Rob
If we try Useless Example #2: By a single column
SUMX(Table1[Product], Table1[Qty])
in calculated column we do not get an error, but get
=Table1[Qty] for each row *Count(Table1[Product]) for all table
can you explain this behaviour please!
Thank you
I believed in DAX, but the following is weird:
The Usefull Example ‘logically’ returns 5.
[Count of Stores] = COUNTROWS(DISTINCT(Table1[Store]))
SUMX(DISTINCT(Table1[Product]), [Count of Stores])
However, the following measure, which IMO is actually the same, returns 6.
SUMX(DISTINCT(Table1[Product]), COUNTROWS(DISTINCT(Table1[Store])))
And what is even more strange:
Apples=2
Oranges=2
Pears=1
but Total=6
and there are no blanks …
Maybe, you have an explanation!?
Experiencing the same problem that Frank mentioned. Getting a different value if a measure is used or if the same formula is written out in sumx. Looks like a bug or is there an explanation for such a behavior?
Mahmoud and Frank, here’s the “answer.” But I agree that it’s weird, and when I’m done with the answer, I’m not sure anyone will feel much better.
1) The “X” functions (and the FILTER function) actually *create* a row context for each step of their evaluation. In other words, inside an X function or a FILTER function, your formulas behave like calculated columns rather than like measures.
2) And, in a calculated column, an aggregate function like COUNTROWS will automatically “include” the entire table. Go try that out in a calc column right now – it doesn’t operate against the current row like a regular arithmetic expression like [Col1] + [Col2]. It counts the entire table.
3) So that “explains” why Frank’s SUMX(…COUNTROWS…) formula returns a bigger number than expected. But why does [Count of Stores] return a smaller number?
4) Go back to step 2 and the calc column you wrote. Now “wrap” your COUNTROWS in a CALCULATE. Literally just do CALCULATE(COUNTROWS(Table)). No filter inputs in the CALCULATE. See what happens.
5) Now you get 1 for every row in your calc column! WTF??? (What the Formula???)
6) That’s because CALCULATE takes a row context and turns it into a filter context. In other words, the aggregation function (COUNTROWS in this case) starts behaving like it would in a measure – and our filter context is just this row, so when COUNTROWS runs, it only sees one row.
7) One last twist! When you reference a measure by name, that IMPLICITLY introduces a CALCULATE behind the scenes! Yes, even though your original measure did NOT use a CALCULATE function, when you reference a measure by name, inside a FILTER or an X function, now you get a “magic” CALCULATE introduced behind the scenes.
So that all REALLY sucks doesn’t it? SUPER confusing. I hate it. But the good news is, you don’t really have to know all of that in order to do 99% of the cool things you want to do. I don’t encounter this problem very often, and it doesn’t hint at other problems lurking below the surface. This is by far the weirdest thing in DAX, in my experience.
Rob, I know about row context and that CALCULATE – whether it is hidden or not – turns row context into filter context. But in the pivottable the ONLY difference is in the bottom line, the total, where there is no filter on rows.
ad 2) if it counts the entire table the result would be 8. But it is 6, obviously the number of distinct stores multiplied by the number of distinct products. But, being an iterator (!) SUMX should give back 5.
For me, it is still not clear, why the some of the parts here is 6. Why 6 and not 8 or maybe 7?
6 only makes sense without a row context, i.e. 2 distinct stores for each row independant of the product.
Anyway, I appreciate your comments and will be waiting for further hints as time goes by.
The COUNTROWS(DISTINCT(Table1[Store])) part of the equation may return 2, 2, and 1 on each row in a pivot table, but that is because the filter context for each of those categories only includes those rows.
Without the implied Calculate when using the measure as the second argument, the Grand Total row includes all the rows when it performs the COUNTROWS(DISTINCT(Table1[Store]))
Try these formulas in calculated columns to help visualize:
[CalculatedColumn1]=COUNTROWS(DISTINCT(Table1[Store]))
=SUMX(DISTINCT(Table1[Product]),[CalculatedColumn1])
Just some thoughts to Frank’s comment (coming in late)
You said “if it counts the entire table the result would be 8. But it is 6,…”
Actually, it will be 6 if it counts the entire table. The “DISTINCT(Table1[Product])” returns a single column table with 3 rows. As SUMX iterates through these 3 rows, it always returns a Count of 2 when used without a CALCULATE. Thus, 2+2+2 = 6
Thanks Rob
This is one of the single most useful comments about SUMX on the internet. Thanks so much!
I love you for this. Finally, the clouds have lifted and I see the light….
[…] https://powerpivotpro.com/2010/02/sumx-the-5-point-palm-exploding-fxn-technique/ […]
I am trying to calculate a churn for a few products and struggling to properly utilize the sumx distinct formulas. My data looks like the below and I would want to calculate churn. BUT I want it at the store level not the product level so store A would have 15 of Churn, Store B would have none as in total(for all products) it has sales for both 2013 and 2014.
Store Product 2013 Sales 2014 Sales
A X 15 0
B Y 10 0
B Z 5 5
C W 5 5
What I need is a formula that first sums the sales by store, and then evaluates if individual stores meet a criteria, and finally adds all instances where they do together. I do not want to have to show all the individual stores in my pivot to arrive at a total number.
Hello,
I wonder how to solve the following problem.
I have two tables (phone prefixes) and I have to correlate them.
[Tab_1]:
12
123
1234
12345
123456
1234567
12345678
[Tab_2]:
12
1233
1238
12889
121
1201
1234567
I need to achieve the following result:
Tab_2 Tab_1
12 12
12 12345678
12 1234567
12 123456
12 12345
12 1234
12 123
1233 123
1238 123
12889 12
121 12
1201 12
1234567 1234567
I know how it works in VBA but I do not know how to use DAX.
can you count unique sales reps that sold 7key sales items out of 30? and the 30 sales items are in the same column…..do you have any ideas?
Guys,
I wonder if you can help me out.
I need to calculate the variation of sales volume of the current month vs the same period of the previous year.
At a product level the formula is working fine, but the subtotals and totals DO NOT ADD UP.
I have tried many approaches and techniques available on the web, but I couldn’t find anything related to calculating a measure using data from different periods.
The formula basically is:
[ (Sales Qty 2016) – (Sales Qty 2015) ] * [ (Sales Amount 2015) / (Sales Qty 2015) ]
My DAX formula attempt is:
=(CALCULATE(sumx(Sales_Data,Sales_Data[Qty]))- ****Sales Qty 2016******
CALCULATE(sumx(Sales_Data,Sales_Data[Qty]),SAMEPERIODLASTYEAR(Date_Table[DateKey])))* ****Sales Qty 2015******
(CALCULATE(sumx(Sales_Data,Sales_Data[Net Sales Inc.Rebate]),SAMEPERIODLASTYEAR(Date_Table[DateKey])) / ******Sales Amount 2015******
CALCULATE(sumx(Sales_Data,Sales_Data[Qty]),SAMEPERIODLASTYEAR(Date_Table[DateKey]))) ****Sales Qty 2015******
Any way that I can calculate the subtotal and totals a per the table below.
Qty 2016 Qty 2015 ASP 2015 Var Vol
Product A 494 1,031 $142.11 -76,315
Product B 10,888 7,706 $428.29 1,362,814
Product C 331 1,218 $215.85 -191,462
TOTAL 11,720 9,961 $372.43 655,112
TOTAL Should be this total–> 1,095,03
Thanks,
Favio
Still helping people after 6 years! Thank you
I think that is the most cool explanation that I have read…. You have explained the “Sum of Qty by Product” and also “Sum of Qty by Store”
What if I wish to have Sum of Qty by Date, Store and Product?? How
I’m new to DAX but trying to calculate delta for usedH in the following example.
Strugling with the subtotal don’t add up..
MAXX and MINX should not be mixed with different custId.
Trying to read and learn but maybe somebody can let me move faster 😉
I guess I need to use SUMX, CALCULATE, DISTINCT somehow…
== data ==
type region custId usedH
A R1 1 2
A R1 1 2
A R1 1 4
B R2 2 8
B R2 2 11
B R2 3 15
B R2 3 17
A R1 4 35
== PowerPivot ==
deltaH=MAXX(Range; Range[usedH]) – MINX(Range; Range[usedH])
deltaH Column Labels
Row Labels R1 R2 Grand Total
A
1 2 2
4 0 0
B
2 3 3
3 2 2
Grand Total
Reposting my Pivot table from previous comment (would love to use a small screen capture instead, but hope “|” will work as col separator somehow also),
Row Labels | R1 | R2 | Grand Total
A | 33 | | 33
1 | 2 | | 2
4 | 0 | | 0
B | | 9 | 9
2 | | 3 | 3
3 | | 2 | 2
Grand Total | 33 | 9 | 33
Such a wonderful explanation ! it was really easy to understand by the step by step guide and simple example !
SUMX and DISTINCT is a very powerful combination. Until Excel 2013 , SUMX function works with DISTINCT (SUMX(DISTINCT(Table1[Product]), [Count of Stores])” and textual fields were visible to use in combination with IF for example SUMX(DISTINCT(Table1([Product]),IF(Table1([Customer]=”A” then measure1 else measure 2)).
However, in Excel 2016 this doesn’t work. When you try SUMX with DISTINCT I am not able to see the other fields except what is being passed as a parameter into DISTINCT. Have you faced this issue in Excel 2016 and any solution?
Thanks so much for sharing your knowledge. I’ve finally been able to move forward from one problem I was facing with DAX.
Again for those reading this article, THERE’S a difference between you simply putting an EXPRESSION in the formula SUMX and you putting a MESURE same as your expression, I don’t know why this language works this way but as far as I am know being able to achieve my goals doing this “Work around” I’m happy.
Apparently, this doesn’t work:
=SUMX(table,expression)
and this works (at least for me, in what I needed to do..):
(you create a mesure with the expression you want)
mesure: =blablabla
and then:
=SUMX(table,mesure)
Keep it up the good work Rob!
Many thanks for this thoughtful post.
Over the 5 years that I have been following this site, I have learned that filter context, row context, and context transition are keys that unlock the most powerful, advanced features in Power BI/Power Pivot.
Many thanks for the great insights along the way!
Both SUM and SUMX are iterators.
If “T” is the name of a table and “c” is a numeric Column in the table
then SUM(T[c]) is just syntax sugar for SUMX(T, [c])
The difference between SUM and SUMX is where as SUM is susceptible only to Column Filters (Filter Context) , SUMX is susceptible to Row Filters (Row Context) as well
So as SUMX iterates through the table other columns of the table are visible to SUMX and can influence the results, where as SUM iterates through the Column but other columns are not visible to it and cannot influence its results
Blast from the past… this is the post that brought me to P3, way back in 2013, when I was first trying to get my head around the more complicated parts of Powerpivot. This particular technique enabled the simplification of multiple 300mb spreadsheets which took hours to update into a 10 minute data refresh on a single 100mb sheet (with about a 10sec pause on a slicer click). I’ve tried and failed at replicating this in Tableau, and I’ve tried replicating this in SAS, but the simplicity and accessibility of this is why I will always defer to Excel and the Power Suite.
Thanks!
[…] Rob Collie explains the power of SUMX() in DAX: […]
Sam, very succinct way of articulating the difference between Sum and Sumx!