Hey folks, got another special guest post for you. Today we are honored by the presence of the SillyBoy himself, Scott Senkeresty. Scott is a very close friend of mine that I met in my first week at Microsoft. These days Scott is still at Microsoft, working on antivirus features.
…and like all of my techie friends, he hears a lot about PowerPivot from me, and has been playing with it in his work. Here is one of his recent experiments:
—
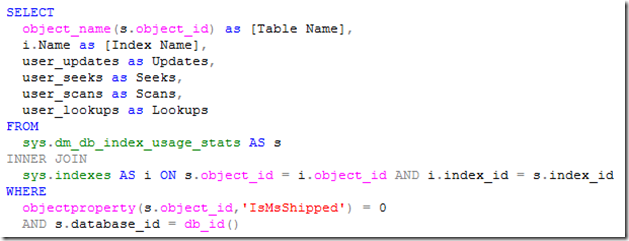
This is a query you can run against any sql database:
It uses a dmv in sql that shows intersesting stats about your index. I used it against our production database, and added a calculated column for “Total Reads” = Seeks+Scans+Lookups.
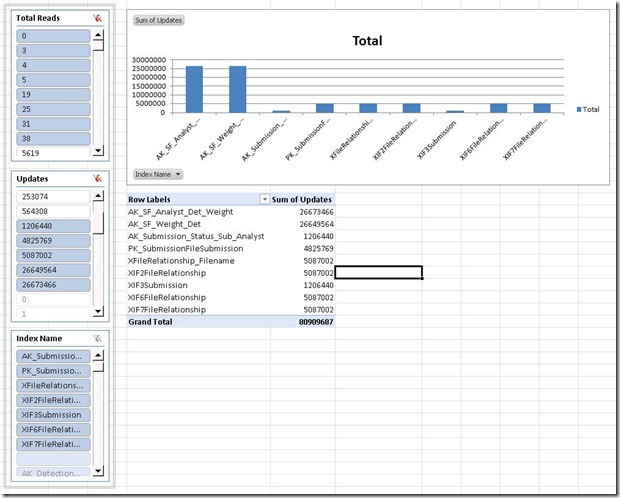
Then I create a Chart n’ Table… just cuz. I created Slicers for TotalReads, Updates, and Index Name (for kicks). I added Index Name as a Row Column and Reads as values.
Now it’s time to par’tay.
I am interested in finding under-utilized indexes (lots of updates, few reads). So, I just use the read slicer and select the first 5 or so. The update slicer automagically updates… and I scroll down the remaining “big numbers”. Select 5 or so of those… and <poof!> my data!
Notice that my Index Name slicer has my nasty’s highlighted. Not required since my table & chart show that data, but it’s cool to see that auto-filtering works so well, I almost don’t need the charts.
And hey look, an index with 26 million updates, and not a single read… Thanks Power Pivot!
And here is the query again as text in case you want to copy/paste it into PowerPivot’s query tool:
SELECT object_name(s.object_id) as [Table Name], i.Name as [Index Name], user_updates as Updates, user_seeks as Seeks, user_scans as Scans, user_lookups as Lookups FROM sys.dm_db_index_usage_stats AS s INNER JOIN sys.indexes AS i ON s.object_id = i.object_id AND i.index_id = s.index_id WHERE objectproperty(s.object_id,’IsMsShipped’) = 0 AND s.database_id = db_id()
Enjoy!

